
Photometry
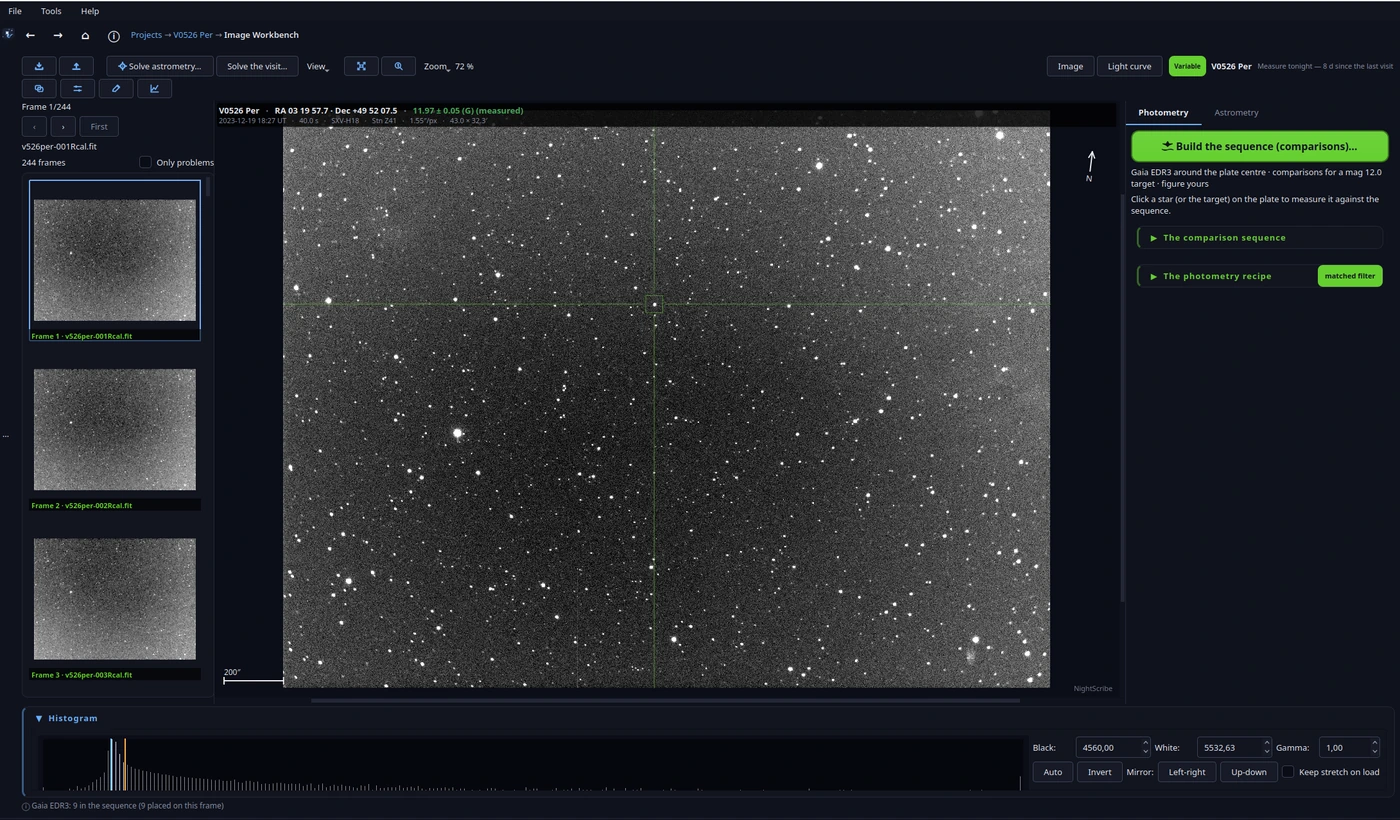
Photometry lives in the FITS editor (Tools → NightScribe Image Workbench, or by opening a plate from a visit). The central idea: you measure against a sequence of comparison stars with catalogue magnitudes, and everything you measure is registered in the project.
The comparison sequence
Build the sequence (comparisons)… queries the catalogues (Gaia, APASS, VSX) around the plate centre and proposes the comparison stars in one go. The proposal avoids the brightest stars in the field and looks for a brightness close to your target's.
Why not the brightest stars in the field? Because the best comparison is the one that resembles the target: similar brightness (same sensor regime, no saturation risk) and, ideally, similar colour. A bright star close to saturating calibrates nothing: its flux is no longer proportional to the light that arrived. And a field star cross-matched with VSX may itself be a variable: that is why the sequence checks the variable-star catalogue before proposing it.
Measuring on a plate
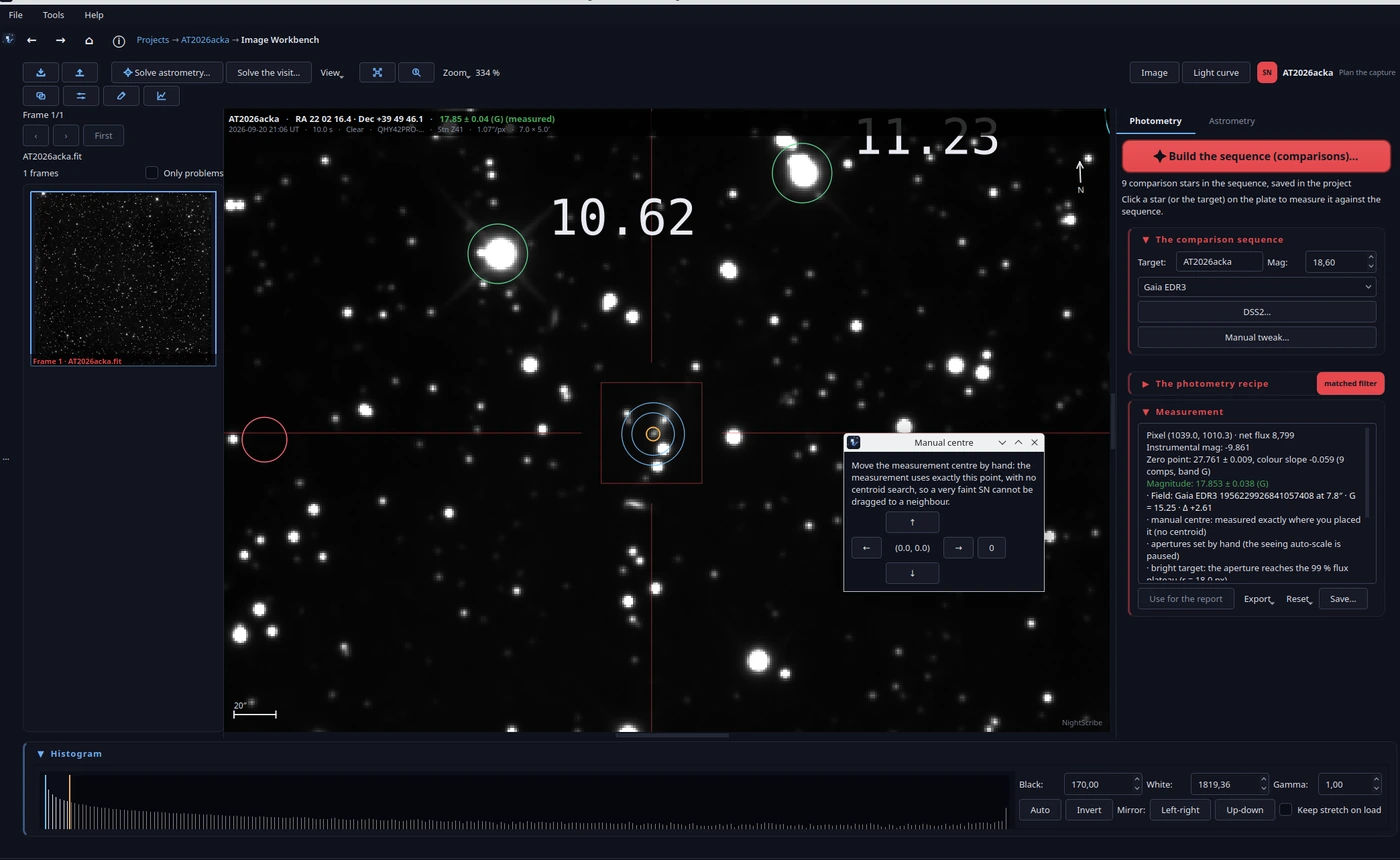
Click a star (or the target) and the app measures it against the sequence. The measurement recipe has three decisions worth understanding:
Matched filter (on by default on new plates): weighs each pixel by the star's shape instead of counting a flat circle.
Apertures: aperture radius and sky annulus, in pixels. The Suggest button proposes radii from the target's own growth curve and its surroundings (crowding, background gradient), with the reasons in plain language.
Manual centre (no centroid): for a very faint SN or a galaxy core, where the automatic centroid can drift to the wrong peak. The centre you place is used exactly, with no refinement.
Why is the matched filter the default? Because it reads about 1.6 times more signal-to-noise than a plain circular aperture, and it does not underestimate faint stars (the classic aperture bias when the background dominates). If your plate has bad pixels or an odd PSF, untick it and go back to the aperture: physics rules over habit.
The gain and your error. A measurement's error bar comes from the CCD equation, which hangs on your camera's gain (e-/ADU). The app resolves it in one fixed order: what you set in Settings, then the measurement on your own frames (two frames of the same exposure tell it), then the one remembered for your camera and setting, and only then the FITS header. The measurement beats the header because the card can carry the camera's setting or a placeholder, and with one of those the error comes out shorter than it is. On an SN you usually bring a single image, and one image cannot measure the gain: the app measures it when it can (your visit's frames) and remembers it, so a later single plate reuses it. If you never have a pair, the "Measure gain…" button in Settings → Camera measures your camera on two frames you point it at and stores it. The panel says where the gain came from.
Advanced… opens the rest of the recipe (sky model, sigma-clip, colour term, host-galaxy subtraction). Each plate keeps its own recipe: changing it on one does not touch the others.
What the band reports. The recipe also decides what the strip over the image shows: the measurement of this plate or the ephemeris' prediction. Choose Ephemeris prediction when the measurement is not worth reporting (a zero point resting on too few comparisons, a trailed object): the figure then wears (eph) and the measurement is kept in the run. When the zero point rests on too few comps, the run says why the others were dropped (off the plate, saturated, non-linear, no positive flux, no catalogue value), so a large error is a figure with a cause and not a mystery.
Host-galaxy subtraction. For a supernova sitting on its galaxy's core, tick Subtract host galaxy (PS1 reference): the app fetches the survey's cutout of the field, lines it up with your plate on the stars they share, broadens it until its star profile matches yours, and subtracts it, so the galaxy's own light goes and the supernova is left. The match is what makes the stars vanish; the app measures it from your own stars and always picks the option that leaves the least behind. It is not perfect (the survey is another telescope and another night), so a few faint rings may remain around the brightest stars, and a star your camera saturated cannot be subtracted at all. The measurement then reads the target on the difference image; the comparison stars keep calibrating on your original plate.
Save… registers the calibrated point in the project (it lands on the light curve and the campaign summary). Export gives the CSV of the points and the AAVSO EFF report, the format the AAVSO accepts for variables.
The photometric series
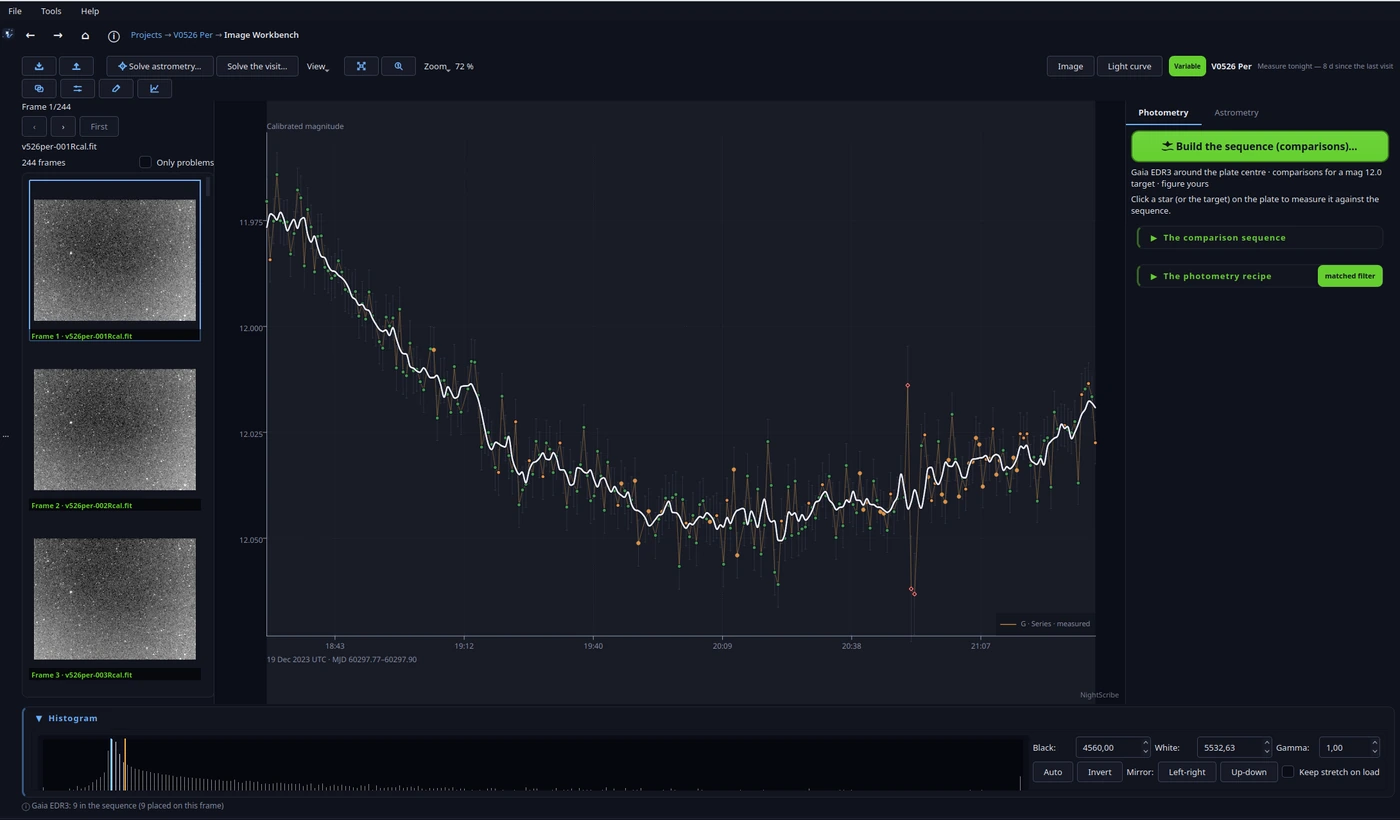
Measure the sequence measures every frame of the visit as one series: one point per frame, with a zero point per frame (tied by the comparison stars, not by a single one), honest photon + gain + read-noise errors, and quality flags per point (saturated, cosmic ray, focus, cloud, unaligned).
Why a zero point per frame and not one for the whole night? Because transparency changes (cirrus, humidity, extinction with altitude). Tying it per frame through the comparisons turns atmospheric variation into a correction instead of an error. The trade-off: if your comparisons are few or poor, the zero point inherits their noise; the orange flags tell you so.
House rules, so you can trust the curve:
A flag marks, never deletes: a doubtful point is flagged and you can hide or exclude it, but it still exists and can be restored.
Group frames combines N frames per point in the measurement domain (fluxes with 1/σ² weights), never pixel stacking. 1 = one point per frame, the usual choice for transits and fast variables.
Why combine fluxes and not stack images? Because stacking mixes times, backgrounds and PSFs from different frames before measuring; combining the measurements keeps each point's exact time and lets the statistical weight do the work. The result is the same SNR, without losing time information.
Undo this run removes only the last pass's points; Passes of this visit… lets you go back to an earlier pass without deleting anything.
Reading the curve (the Chart… dialog)
The curve dialog changes what you see, never what you measured. The essentials:
Scale: CALIBRATED (real magnitudes) or Δ MAGNITUDE (everything referred to a stated level, so a tenth of a magnitude fills the chart).
Robust and Fix range: make the axis follow the core of the curve (one anomalous point cannot flatten the rest) or fix it by hand.
Errors: per-point photon error bars and the zero-point band. The ZP systematic belongs to the whole night, so it is drawn as a band, never as a per-point bar.
Quality colours / Hide flagged: colours each point by its quality (green clean, orange usable, red in doubt) or hides the red ones.
Plot binning: groups the chart's points (presentation); it is independent of the measurement's frame grouping.
Mark outliers: flags points that stray from their neighbours by more than N robust sigmas (4.5 catches only the wild ones; 3.0 also the suspicious). Excluding them is a separate, explicit decision.
Period and phase
Period and phase (in the curve dialog, or from the project) searches a variable's period with two methods: Lomb-Scargle (fits a sinusoid and gives a false-alarm probability) and PDM (assumes nothing about the curve's shape; the right cross-check for an eclipse). "Both" runs each and tells you whether they agree.
The report states what was found and, above all, what the data cannot say: cycles covered, false-alarm probability, aliases. Save the period to the project folds the curve by that period from then on; Export the report… writes the PNG and CSV.
Why two methods? Lomb-Scargle is powerful when the curve looks like a sinusoid (RR Lyrae, δ Scuti), but an Algol-type eclipse (two minima of different depth, flat bottoms) is not sinusoidal, and its true period can show up as a weak alias. PDM assumes nothing: it folds and measures the scatter. If both agree, the period is solid; if not, the report tells you why.
Why "one night cannot fix a period"? With a single night you cover a fraction of a cycle and the periodogram returns aliases of the sidereal day. The Add the community curve… button adds the star's AAVSO observations (in grey, never mixed with yours) and repeats the search: that is how periods are truly fixed.
Exoplanet transits
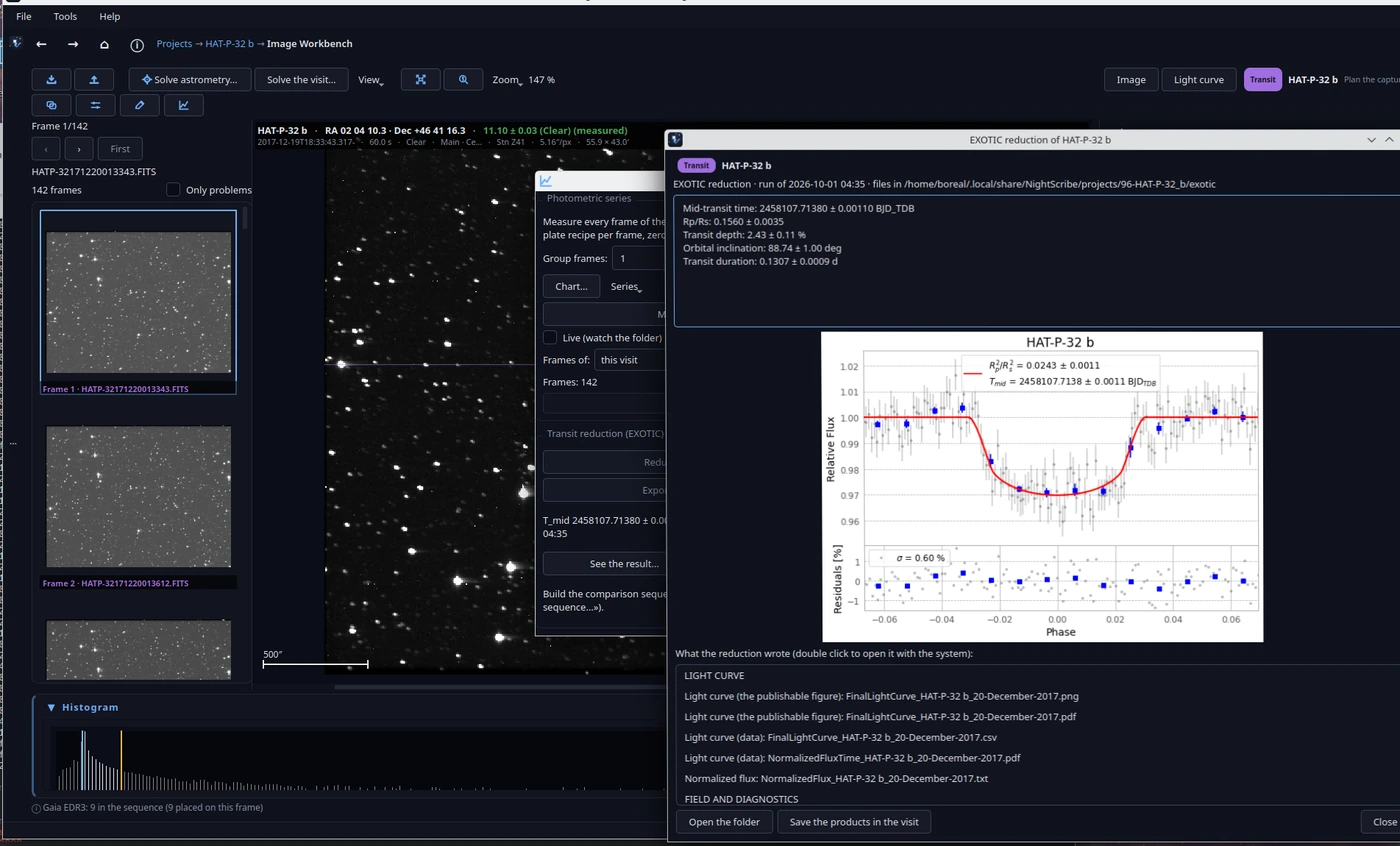
For a transit project, the editor adds the EXOTIC block: NightScribe prepares the inits.json (with your observatory and camera data from Settings), runs EXOTIC in its own environment if you configured it, imports its curve and parameters, and exports the 3-column file for ExoClock with the ExoClock_info.txt filled in.
Getting that environment is the one thing that is not automatic. EXOTIC needs a Python of its own (3.10 to 3.12, never the one the app runs on) and a heavy stack, and it must live outside NightScribe. The easy path: the project publishes the environment ready to unzip in its own release, exotic-env, one zip per platform with its own Python inside, so you download it, unzip it anywhere and point Settings → Measurement → Advanced → EXOTIC at the interpreter inside. The other path is Prepare environment in the same place, which builds one for you with the Python you already have (it needs network the first time and about a gigabyte). Both end in the same place, and neither touches the rest of the app.
Why so much fuss? Because EXOTIC pins its own versions of numpy, astropy and numba, and those pins are the physics: they are what makes its fit reproducible. Sharing them with the app would break one or the other, so the environment is separate and disposable: if it gets damaged, you build it again and nothing else is lost.
Why ExoClock? Because ESA's Ariel mission needs to know when each planet transits years from now, and transits drift. Your curve, even from a 20 cm telescope, updates the ephemeris of a planet a space telescope will observe.
Further reading
The depth lives in the repository, in the topic documents the app opens from its ?:
docs/PHOTOMETRY.md: the full treatment of the zero point, the comparison stars and the errors, with a glossary;docs/SNR.md: the signal-to-noise budget and the limits;docs/PRECISION.md: what the numbers mean, measured.
Next: 07. Astrometry.